Today VersionOne released the 11th Annual State of Agile report. You can view it here. This thread is intended to be an open space to discuss its results and your thoughts on the report.
11th Annual State of Agile Report
JayH
#2
I’m going to take some more time to dive thru this, but on the first pass a few things jumped out:
- Scrum is still the big dog as far as adoption, and by a large margin. However I think that as larger orgs cross the chasm into adoption and build their business agility we’re going to see way more in the hybrid space over time.
- SAFe is huge, not surprisingly. I’m sure now that they’re offering even more certifications it’ll grow even larger.
- Funny how Excel is second only to JIRA as far as tooling; I wonder if JIRA’s penetration is due to the relatively low cost. With SAFe being the clear leader in the scaling space I’m surprised Rally/V1 are not higher…maybe due to the prohibitive pricing structure?
- The kicker for me is the last slide…we need to find those 38% of people that recommend IBM Rational DOORS and exile them to some distant island. My god, one of the most painful and ugliest apps I have ever used.
ryan
#3
I’m just now starting to decompose the report - crazy week at work and the Agile Uprising event Thursday took its toll…
I find this to be super compelling:
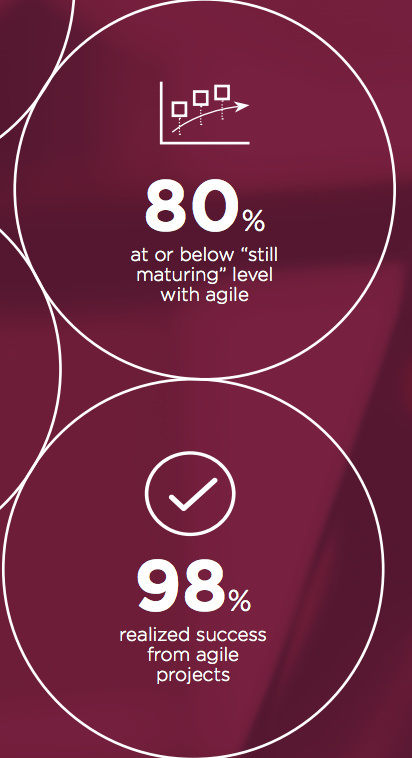
- While the overwhelming majority of respondents say they are still finding their way, they are seeing unprecedented success.
One of the most notable trends from the survey is the
importance of measuring how much business value
your organization is delivering. This year business value
has become a much more popular measure of an agile
initiative’s success.
Business value was cited as the second most popular
measure (46%) of an agile initiative’s success, rising
from fourth in the prior year. Conversely, it ranked as the
eleventh most popular measure (23%) on a day-to-day
basis. This highlights an important inconsistency between
how more strategic areas of the enterprise are measuring
success and how success is being measured at the team
level.
-
 this
this
-
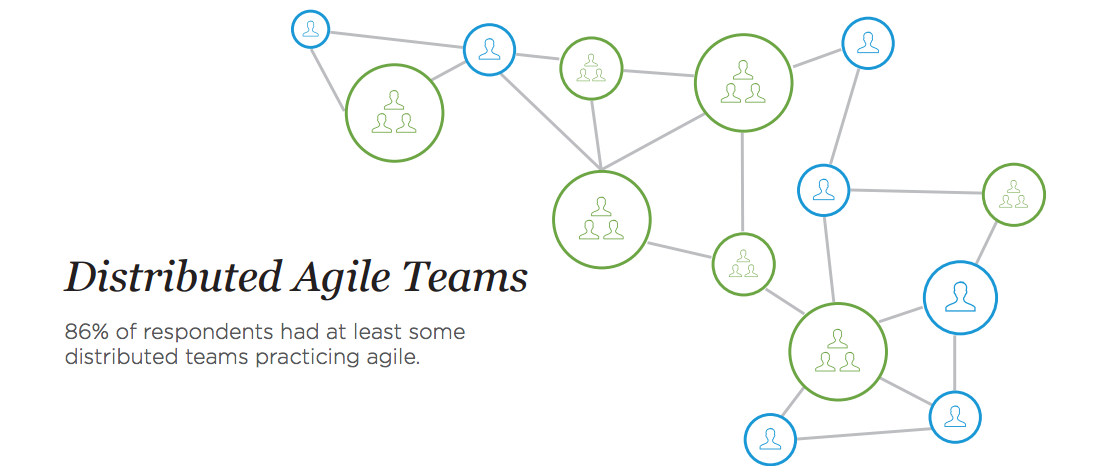
When you have “some” distribution, you have a distributed team. Making a loose connection, as they did in this graphic, seems odd.
-
Managing distributed teams will not be going away, and teams that win will have to figure out how to be effective in this reality.
Scrum remains king.
- 2011 - 52% Scrum
- 2012 - 54% Scrum
- 2013 - 55% Scrum
- 2014 - 56% Scrum
- 2015 - 58% Scrum
- 2016 - 58% Scrum

- While it bothers me that XP as a framework is essentially dead, seeing the practices live on is awesome! I would love to see the number of respondents that don’t know what practices are used, to show the separation of folks that create code and those that manage process.
jasonlittle
#4
I put together a summary of the first 10 reports…same reasons and problems year after year so I’ll assume they stayed pretty much the same for this one: http://leanintuit.com/downloads/
ryan
#5
I signed up, downloaded and read your report. I will now cry into my coffee. You are correct, sir.
ryan
#6
It is looking more professional. Better fonts and graphics than the crayon approach or earlier reports. So theres that…
jasonlittle
#7
They did change some of the questions over the years, and in 2009 they used rankings instead of % responses, but overall the biggest change is that Scrum dipped from a high of 70% to 52% in 'method usage"
I personally use the ‘all-purpose, all-method’ spray on transformation kit nowadays: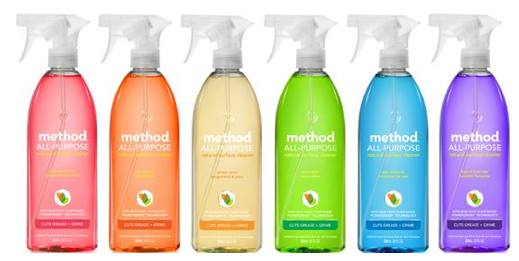
Jonster1220
#8
Is it normal to look at more than half the images and shake my head in dissapointment?
You can’t “survey” out culture and assume others can benefit/utilize those metrics without context to how the organization operates and delivery value. 58% use scrum, fantastic. Consider 80% of the group has relayed that they are at or below maturity level “with agile”, makes you think twice before accepting the numbers.