Measuring Flow Efficiency


#1

I’m wondering if any of you here are measuring your teams’ flow efficiency?

Flow efficiency, sometimes called Process Cycle Efficiency is the ratio between the amount off time spent on value adding activities and the total lead time. So FlowEfficiency = 100 * valueAddTime/LeadTime.

I’m asking because in order to do this, one requires a Kanban board with columns specifically dedicated to value states and queue states. For example, “In Development” would be a ‘value’ state and ‘waiting for QA’ would be a ‘queue’ state. Your overall flow efficiency is the ratio between time spent in value states and time spent in queue states for the entire value stream.

So firstly I’m wondering if any of you are actively measuring this?
Secondly I’m wondering what columns you use on your Kanban board, and which columns are value states or queue states.
Thirdly I’m wondering if you have any difficulties measuring flow via a Kanban board. For example, it requires that people move their stories promptly when the work progresses into a new state.

Many thanks,
Stu


#2

If my teams had any flow, I’d measure it :stuck_out_tongue:

I believe in the practice with all of my heart. And try to incorporate it in all visualizations.

It is invaluable to answer the question “Why did this 3 point story take so long?”

Without the wait states, one doesn’t know.

  1. Yes. Actively measuring

  2. Columns map to workflow, with as much simplification as possible, to avoid too much ticket moving. And things change over time depending on what wait state is the biggest time waster. For example, if teams are not pairing, and not keeping up with code reviews: Waiting for Review is a column. On the other hand, if the team’s solved that, don’t need that column/workflow step anymore and it goes away. When the efficiency theft is stakeholder signoff, then Waiting for Sign Off gets a column. The other lever is fairly strict WIP limits.

  3. Yes, stories must move. And people will move 'em along the board only if they find value in the resulting info obtained. For my teams, the value has been exposing the system drag, solving for it, and seeing their thruput get more predictable and faster. Which results in fewer priority switches, fire fights, etc.


#3

Thanks Andy.
Do you measure flow manually or via a tool such as Jira?


#4

JIRA and built in CFD
Also I turn on “Time in Status” indicator on the Kanban.

Some argue that JIRA’s CFD is not technically “accurate”

It’s “good enough for now” for me.

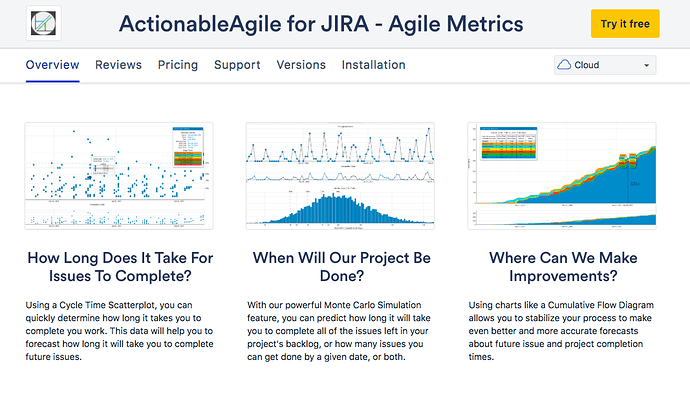
Daniel Vacanti also has a suite of tools:

And an extension to JIRA:

For some very nice Ha/Ri level visualizations, above and beyond the built in JIRA stuff:

  • Cycle Time Scatterplot
  • Monte Carlo Simulation
  • Aging Work In Progress
  • Cycle Time Heat Map
  • Flow Efficiency


#5

Thanks Andy, much appreciated.
On a slightly pedantic note, do tickets being left in states overnight affect your metrics much in practice?
For example, if a story goes into “in progress” at 4pm on day 1 and leaves at 4pm on day 2, the actual time in progress according to Jira would be 24 hours, but considering a 9am-5pm working day it’s actually only been in progress for 8 hours. That’s a pretty big difference. How do you deal with this?


#6

If that type of “precision” matters to you, see if your tool of choice allows for definition of working hours, as well as not counting weekends.


#7

@Smrimell - My company’s project tracker (not JIRA) has built-in workflow states at both Epic and User Story levels. Roughly speaking, they translate to Idea>Ready> In Progress>Release Ready>Complete. Even though these aren’t necessarily recorded in the Kanban or Scrum Boards, I’m able (laboriously) to determine our lead/cycle times as the states are in the audit trail. No granularity however on value vs. queue states.

Management has very much been focused on velocity across (70+) teams to determine predictability. I’m building the case that these kind of actionable metrics will provide a better window into this…

Any others have successes with similar approaches?


#8

I’ve certainly had success in the past highlighting the effect of queues on velocity. I think it’s frequently assumed that a team’s velocity is primarily determined by how fast they can work. This is untrue in the vast majority of cases. Most teams’ velocity is primarily determined by the queues in the system. Visualising those queues is key. I’ve used cumulative flow diagrams a lot to understand flow as they visualise queues very effectively.


#9

Podcasts on the subject of flow: